Plot a life table
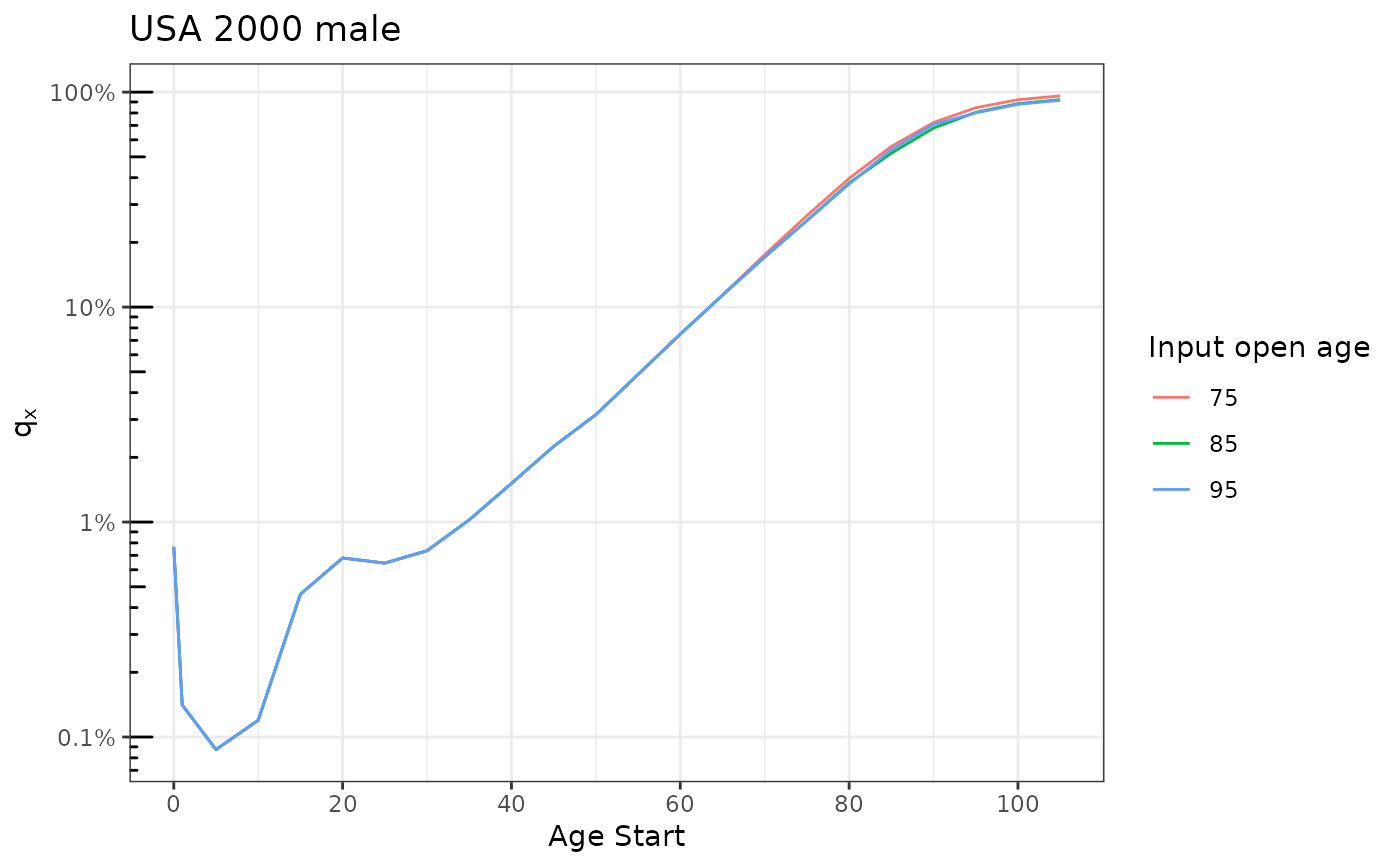
plot_lifetable.RdCreate a log probability of death plot of the given life table, optionally including multiple lines to indicate different input open age intervals.
plot_lifetable.RdCreate a log probability of death plot of the given life table, optionally including multiple lines to indicate different input open age intervals.